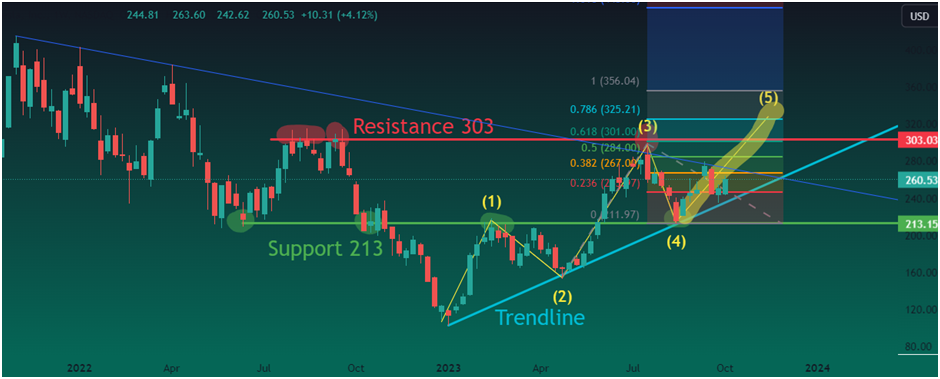
Technical analysis of Tesla stock chart has identified 3 signs of a bearish trend reversal for the coming days.
Contents
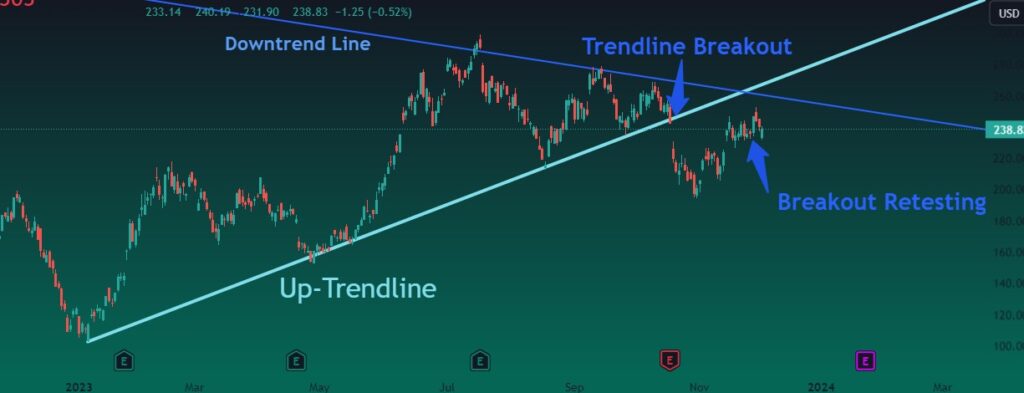
1. Up-trend line Broken + Rejection from Downtrend line
Trend analysis of TSLA stock reveals that the up-trend line holding the stock price has been broken downwards. After its breakout, it has been retested by price which further strengthens the breakout of the up-trend. Further, the price has been rejected from a previously downward falling trendline.
It infers that not only uptrend has been abolished, but the stock is ready for a bearish trend.
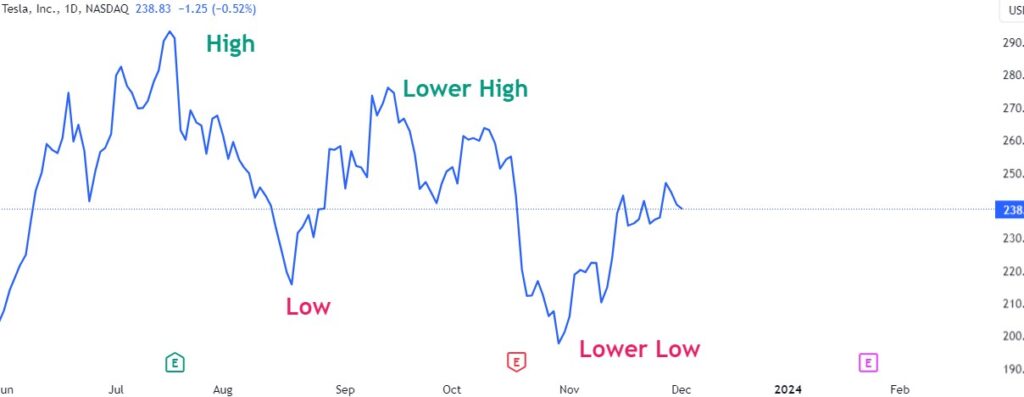
2. Formation of Lower Lows
Another major sign of a bearish trend is the formation of lower lows by TSLA stock. The figure below shows the Tesla stock chart of daily time frame. Clear lower lows can be identified in the stock chart.
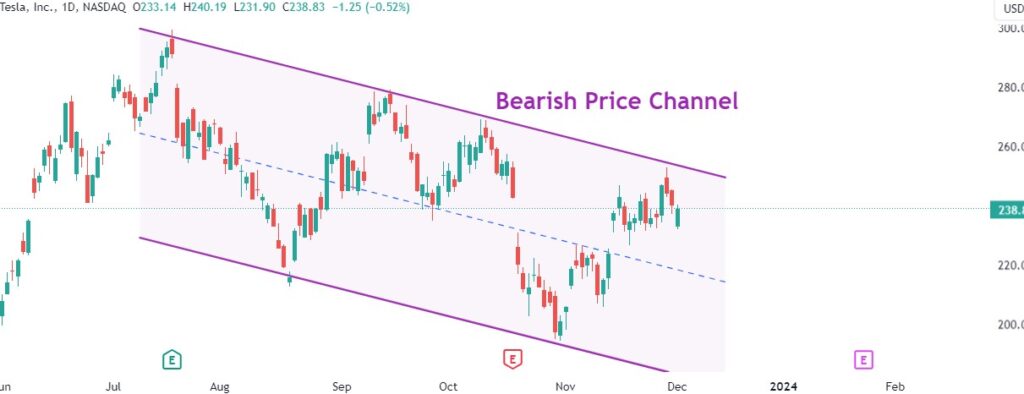
3. Bearish Price Channel
Closely looking Tesla stock price action for the past few weeks reveals that the stock price is moving within a narrow range forming a price channel. The price channel direction is downward making it a bearish price channel.
End Note:
This technical analysis involved a systematic study to decode Tesla’s stock trend. The study is presented in the most comprehensible format in this article.
It has presented 3 clear signs of a bearish trend reversal in Tesla stock. Which trading strategy you use to benefit from this analysis, the choice is yours!