Technical analysis of the Dow Jones Industrial Average is presented in 5 simple steps.
Contents
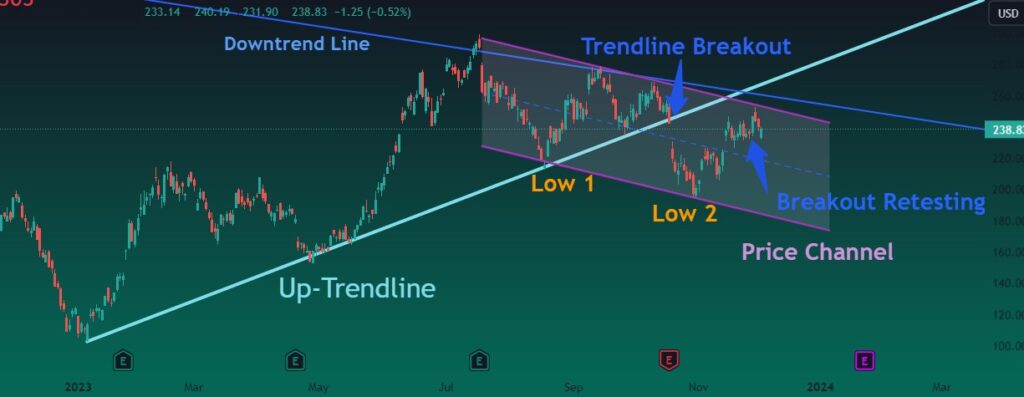
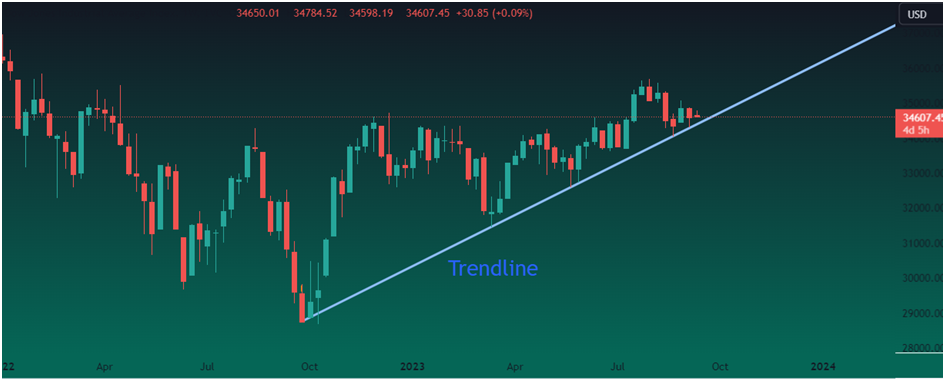
Step 1: Trend determination:
A trend line is drawn by connecting successive lows. It shows a clear uptrend in the Dow Jones Industrial Average Index.
Step 2: Construction of Support and Resistance:
The near-term resistance lies at 36524 and support lies at 34336.

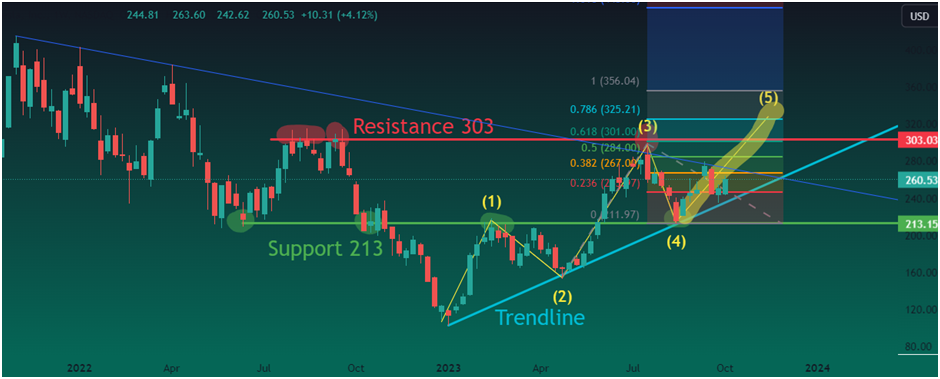
Step 3: Determination of upcoming swing through Elliot wave Analysis:
Elliot wave analysis reveals that two upside rallies have passed with two downside corrections. Currently, 5th wave is about to start on upside.

Step 4: Target Estimation through Fibonacci Extension:
Upcoming market target can be determined through the length of the 5th wave. For this, Fibonacci-based extension is applied to 4th wave. It reveals a 100% extension of the 4th wave completed at 36953 where the resistance zone lies at 36952. So there is a strong probability that the 5th wave will be formed as a result of a 100% extension of the 4th wave.
So estimated short term target for DJI is 36953.

Step 5: Estimated time for hitting the Target:
The time for hitting the above-calculated target can be estimated through the Fibonacci time series. The figure below shows Fibonacci time series applied to DJI weekly chart. Accordingly, the tentative time for hitting our target 36952 is October 9, 2023.

Final Remarks:
Technical analysis suggests a clear uptrend of DJI with a short-term target of 36953. The tentative time for hitting the target is the 2nd week of October 2023.