Are you perplexed by Tesla’s stock price action these days? Or are you curious about the upcoming price target?
This Technical Analysis of the Tesla Stock chart will not only explain how the stock is behaving these days but also reveal how the stock will be performing in the coming days. It also forecasts a medium-term Tesla price target.
This technical analysis comprises 4 steps; trend analysis, study of support & resistance, determination of upcoming move direction, and forecasting target price.
Contents
I. Trend Analysis:
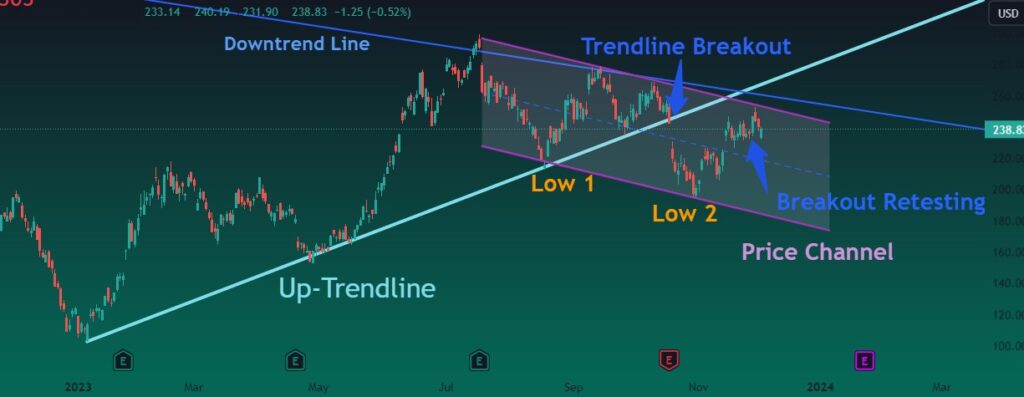
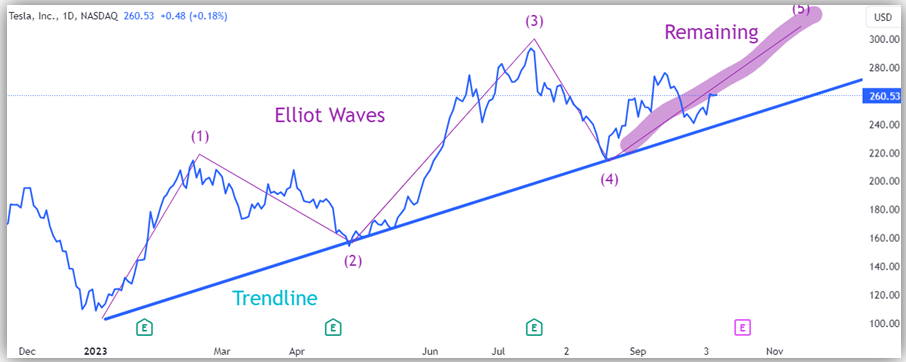
Since the start of the year 2023, Tesla stock has been in an uptrend as indicated by the up-trend line with higher highs and higher lows.
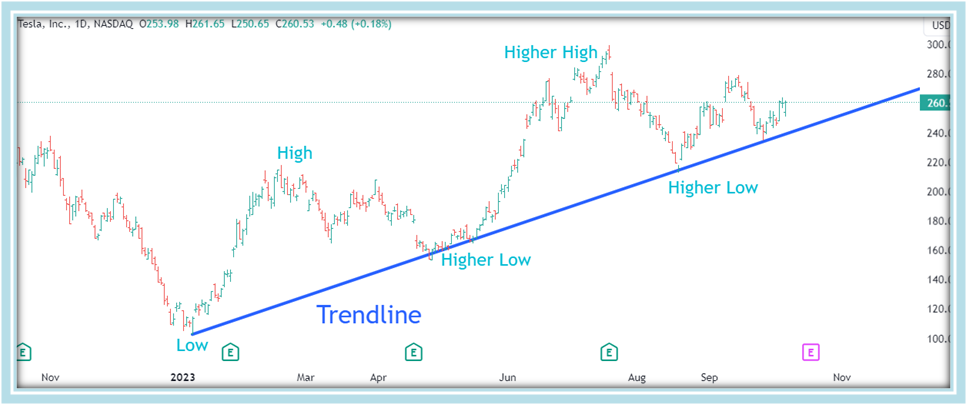
However, this uptrend is being hammered by the previous downtrend line as shown in the figure below.
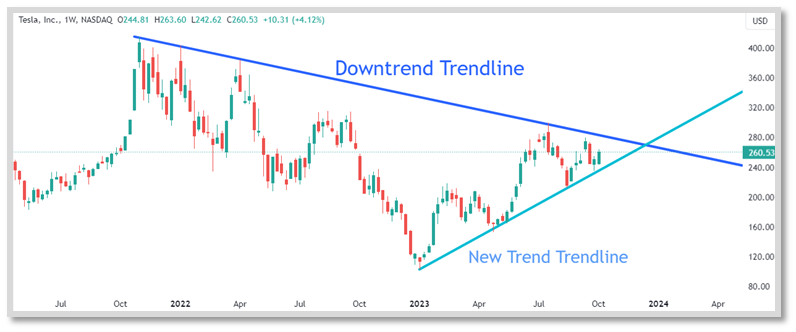
From the above two trend lines (rising and falling), it seems that the price has reached a gray zone and no clear trend prevails. A strong trend will be established after the breakout of either of the trend lines.
To further analyze price action, we need to analyze demand and supply zones.
II. Study of Support/Resistance Zones:
The historical supportive zone lies at 216 which has pushed the price upwards. On the other hand strong resistive zone lies around 305~309 which has hammered the price downwards.
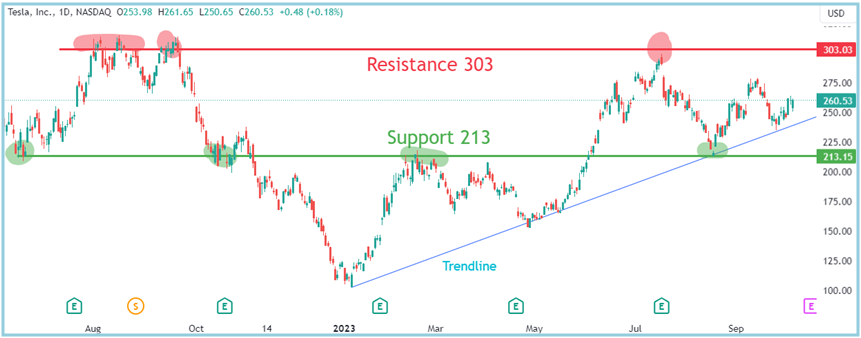
For the time being, TSLA stock price is being ping-ponged within historical support and a strong resistive region. Further study will aid us in decoding the direction in which the stock price will break out.
III. Determination of Upcoming Move Direction:
The direction of upcoming stock price move is determined through Elliot wave analysis and technical chart pattern formed.
- Elliot Wave Analysis:
Elliot wave analysis of the TSLA price trend reveals that 2 upside waves (wave 1 and wave 3) with 1 downside corrective wave (wave 3) are completed. Currently, corrective wave ‘4’ is in progress. After the completion of Wave 4, wave ‘5’ will be in the upward direction according to Elliot’s Wave theory.
- Study of Technical Chart Patterns:
A symmetrical triangle is formed in the TSLA daily price chart as shown in the figure below. It represents price caging for a few days. After the completion of the triangle, a definite price movement will be observed on either side.

To which side this triangle will break out?
Usually, the triangles are a continuation pattern and offer a breakout in the direction of the previous trend. So probabilistically, this triangle will offer a breakout to the upside.
The above analysis suggests that Tesla stock will continue its upward price trajectory after the current sideways move.
IV. TSLA Price Target Estimation:
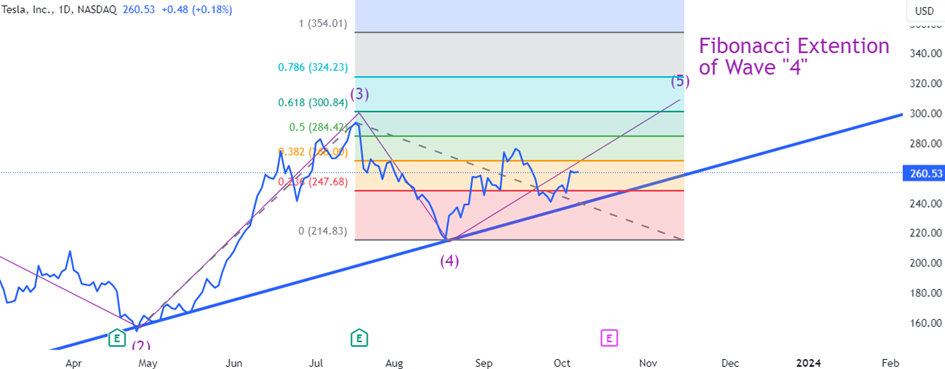
Target can be estimated from the length of the 5th Elliot wave according to Elliot wave theory. The length of wave ‘5’ can be determined from the Fibonacci extension of wave ‘4’. Applying Fibonacci extension of wave ‘4’, the minimum length of wave ‘5’ is $324 (78.6%) or $354 (100%). So the upside target price for Tesla stock lies at $324 or $354.
Secondly, the upside breakout of the triangle will offer an upside move equal to the maximum width of the triangle. On the upside breakout of the triangle, it will offer an upside move to $343.

End Note:
Technical analysis of the Tesla stock price chart reveals that currently the stock price is caged inside two trend lines (an up-trend and a previous downtrend trend line). Historical support at $213 is pushing bounces the price up whereas a strong resistive zone at $303 hammers it down.
However, Elliot wave analysis predicts that the 5th wave remains in the upward direction. So there is a strong probability of an upside move. The target price of the upside move is estimated by applying the Fibonacci extension of the 4th wave. The forecast is aided by a triangle target on the upside breakout.
Accordingly, the near-term upside target for Tesla’s stock price lies between $343 to $354.