
You can decipher equity markets if you know trading chart patterns. They’re the secret code to understanding market behavior. In this article, we’re diving into the three most successful trading chart patterns: wedges, triangles, and head and shoulders. With real-life examples and practical insights, special tips are provided to identify and trade these chart patterns. Master these patterns and gain the upper hand in the trading game.
Contents
1. Wedge Chart Pattern:
Wedge is the most recurring trading chart pattern. A wedge pattern is formed when two rising or two declining trend lines are tilted towards each other to the extent that they intersect each other after a suitable time.
Example:
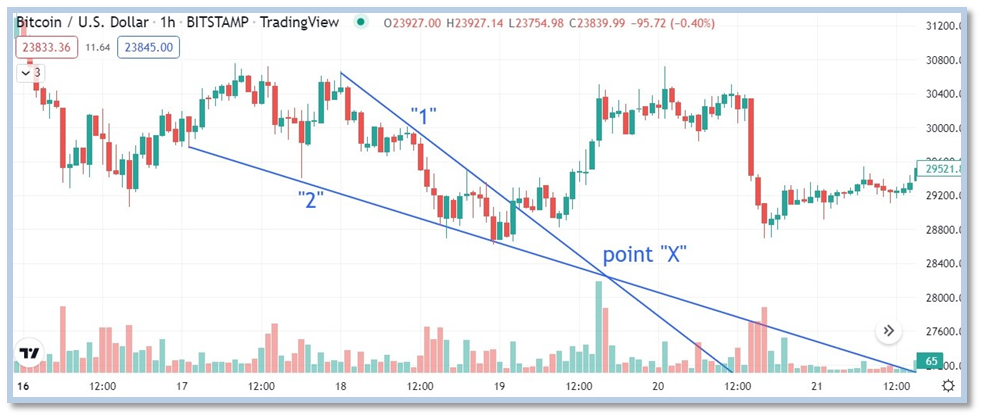
A wedge pattern formed in the 1 hr chart of Bitcoin is shown in the figure below. Here two trend lines are drawn; Trend line “1” is drawn by connecting subsequent high points in the graph and Trend line “2” is drawn by connecting successive lows. Line “1” is intersecting line “2” at point ‘x’ forming a perfect wedge.
Types of wedge patterns:
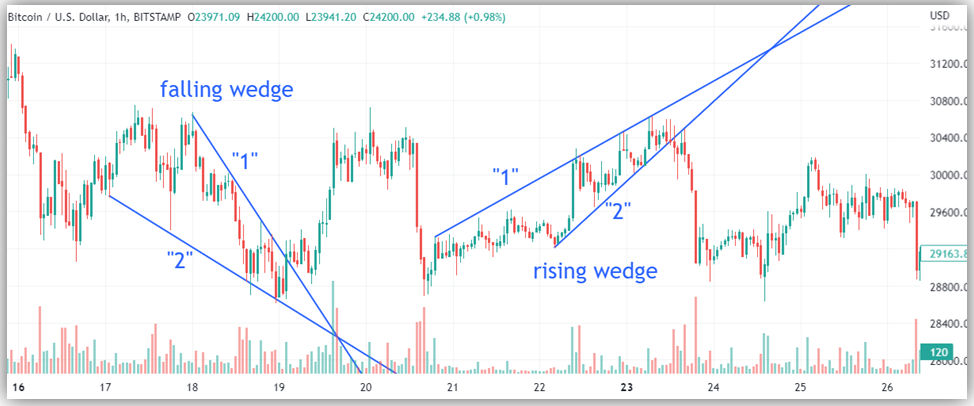
There are two types of wedges; falling wedges and rising wedges.
How to Trade Wedge Pattern?
Once you have identified a wedge pattern, wait for its breakout. A breakout is confirmed when the price violates the wedge line and gets a rebound after retesting. After breakout confirmation, enter a long side trade for a falling wedge and a short side trade for a rising wedge.
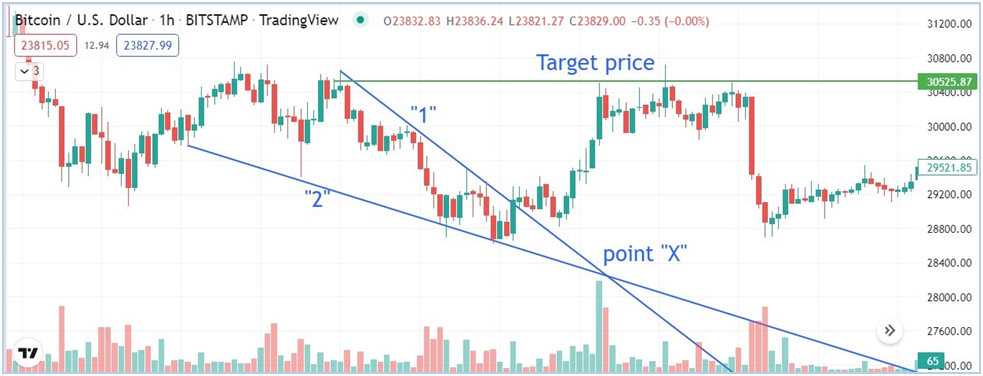
Target Price for Falling Wedge; Highest point of the trend line forming the wedge pattern.
Target Price for Rising Wedge; Lowest point of the trend line forming the wedge pattern.
Pro Tip to Find Wedge in Chart:
Mostly wedges are formed in corrective waves i.e. 2nd or 4th Elliot wave.
2. Chart Pattern Triangle:
A triangle pattern is formed when a rising trend line and a falling trend line intersect each other. A triangle can also form if one of the trend lines is straight and the other is sufficiently inclined/declined to cross the first one.
Example:
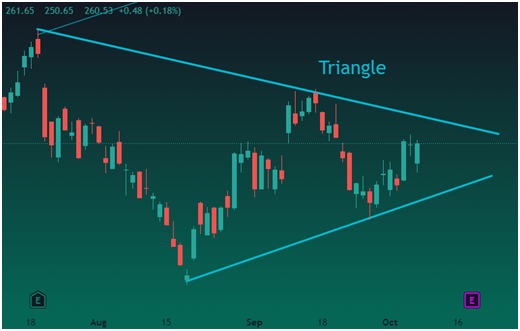
A triangle pattern formed in 1-day price chart of Tesla stock is shown in the figure below.
How to Trade Triangle Pattern?
The breakout of a triangle is confirmed when either of the trend lines, constituting the triangle pattern, is breached by a price move.
Upward break out; Trade on the long side with a price target equal to the maximum height of the triangle i.e. distance at the start of lines forming the triangle.
Downward break out; Trade on the sell-side with a price target equal to the maximum height of the triangle i.e. distance at the start of lines forming the triangle.
A typical triangle pattern developed in the hourly chart of TSLA is shown in the figure below:
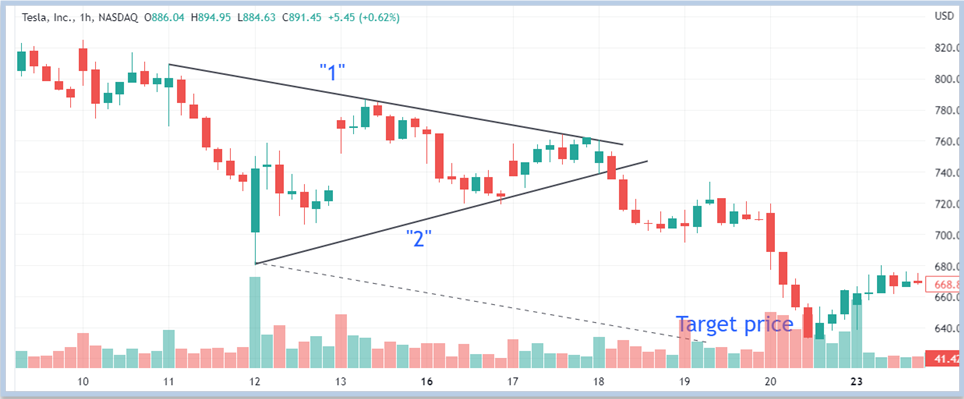
After confirmation of break out, the price target has been determined by the dotted line. It has been drawn by dragging trend line “1” to the starting point of trend line “2”. It has exactly hit the target of the triangle.
Pro Tip: Where to Find Triangle Pattern?
Mostly, a triangle pattern is formed in the midway of a major trend representing a temporary halt to the trend. However, occasionally triangle is also found at the bottom of a downtrend.
Further, many times 4th Elliot wave takes the form of a triangle pattern.
3. Chart pattern Head and shoulder:
Head and shoulder is an important technical chart pattern because most of the time it results in price reversal. It consists of two shoulders and a head in the center. The support line at the low of the head and shoulders is termed as neck-line of the head and shoulder pattern.
Example:
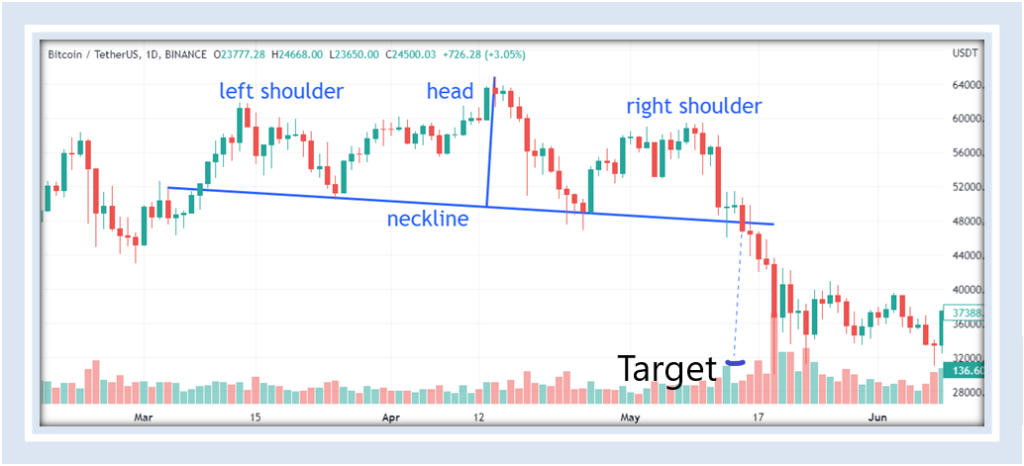
A typical head and shoulder pattern formed in Bitcoin daily chart is shown in the figure below.
Types of head and shoulder chart patterns:
Technical analysis of chart patterns reveals that there are two types of head and shoulder patterns; normal head and shoulder pattern, and inverse head and shoulder pattern.
How to Trade Head & Shoulder Pattern?
Breaking of the neckline with huge volume marks the breakout of head and shoulder pattern formation.
On a downside breakout, trade on the short side with a target price equal to the maximum height of the head & shoulder i.e. the distance between the ‘neck-line’ and the head’s peak.
The converse is true for an upward breakout of an inverse head & shoulder pattern.
Pro Tip to Find Head & Shoulder Pattern:
Technical analysis of the trading charts reveals that head and shoulder pattern is found near some important tops. Conversely, an inverse head and shoulder pattern forms after sufficient price decline and is found near some important bottom.
End Note:
Technical analysis of equity charts provides useful insights to decode the behavior of traders reflected in the form of trading chart patterns. These patterns are quite useful for traders as they offer definite price moves after a breakout.
Mostly, chart patterns hit their respective price targets after break-out confirmation, however, sometimes they are unable to complete their formation and hence distract from the consequent moves. So after identification of technical chart patterns, take a trade entry only after confirmation of break out of these chart patterns. Last but not least, never forget to place stop loss on the opposite side of the breakout of the chart patterns.
FAQs:
How many chart patterns are there?
Over time, traders have identified more than 30 chart patterns in technical analysis. Most of them are rare in occurrence. The most commonly occurring trading chart patterns are wedge, triangle and, head and shoulder. Not only these are common but have successful and time-tested price action predictions.
What is the chart time frame for the occurrence of stock chart patterns?
They occur on all time frames; minutes, hourly, daily, and weekly charts. So a trader ought to do technical analysis in different time frames to search for trading chart patterns.
Does technical analysis of chart patterns fail?
Sometimes trading chart patterns are unable to complete their formation and hence distract from consequent moves.
What is the most accurate technical chart pattern to trade?
Wedge, triangle and, head and shoulder are the most successful and accurate technical chart patterns.
What are trend line patterns?
The above-mentioned patterns are equally found in line price charts and are also known as trend line patterns. However, candlestick patterns are found only in candlestick charts.
How do you trade in chart patterns?
Wait for the breakout of the chart patterns and trade according to the respective target price mentioned above.
Pingback: GBP/USD on the Brink: Technical Analysis Signals a Downtrend
Pingback: Day Trading Crypto: Best Strategies & Special Tips