
Are you curious about knowing how equity market is behaving and how will it unfold in coming days? Technical analysis of the financial market will best serve your need. Not only it explains ongoing market move but also helps you scrutinize best trade opportunities. Stats reveal that equity investors who use technical analysis gain returns significantly higher than others. This article describes basics of technical analysis including 5 easy steps for doing technical analysis of any financial market.
Contents
What is technical analysis?
Studying (past and present) market price movement to predict future market move is termed as technical analysis of financial market. Technical analysis consists of determining market trend and prediction of how long this trend will continue. In other words, it is a systematic approach to determine the right buying and selling levels for trading.
Overall, it is a tool for making strategic decisions in uncertain financial markets.
Basis for Technical Analysis:
It is based on Dow Theory which states “Stock Market price chart discounts everything” i.e. current market price chart entails everything that happened and impacted the market in the past. So if a person deeply studies price chart, not only it can decide how market moved in the past (at particular level and circumstances) but it can also estimate how market will behave in upcoming time.
How to do a Technical Analysis of Financial Markets?
The following 5 steps describe the simplest way of doing a technical analysis of the financial markets;
Step 1 Market Trend Determination:
Equity market Trends can be determined by two ways; trend line or moving average. Construct a trend line by connecting successive lows of the price chart. If the trend line slopes upward, the market is heading upwards. Conversely, a downward pointing trend line indicates a down trend.
On the other hand, by applying moving average, if moving average slopes upward, it is uptrend and vice versa.

In case, if a trend line is neither upward nor downward, the market will be in sideways trend.
Step 2 Trend Confirmation through Volume Analysis:
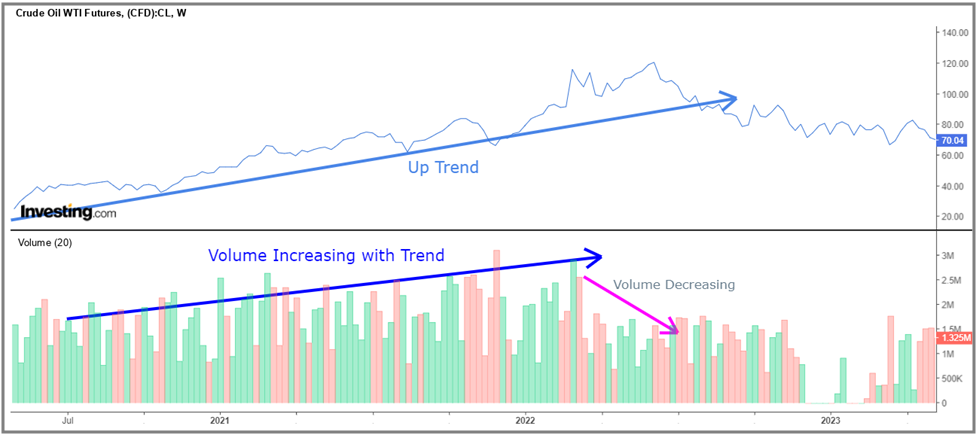
After finding market trend, analyze the pattern of trading volume for confirmation of the trend. If trading volume increases in the direction of prevailing trend, the trend is strong as more traders are believe on the trend. Conversely, a decreasing volume with the progress of a trend reflects a weak trend_ which may change soon.
The figure below shows the volume profile during WTI Crude Oil’s bullish trend. As the trend proceeds, volume is increasing indicating a strong bullish trend. At the final stage of this bullish trend, trade volume started declining which reflect weak trend. The uptrend was abolished afterwards.
Step 3 Market Target Estimation by Support and Resistance:
After confirmation of market trend, its target is estimated from upcoming support or resistance.
For this, construct support level by drawing horizontal line connecting most of the preceding chart troughs. Similarly, draw resistance level by drawing horizontal line connecting most of the preceding chart peaks. Most of the time market price returns after hitting a strong support or resistance level. However, if the market breaks a support or resistance, the next target will be the net upcoming support or resistance.
The figure below shows a bullish trend of Amazon stock trading at 129.33. To estimate next price target, a horizontal resistance line has been drawn by connecting a previous peak and a trough. So near term target of Amazon stock lies at the resistance level of 142.82.

In case, no support or resistance lies next, the target will be estimated by applying Fibonacci extension/retracement of the previous move.
Step 4 Chart Patterns Analysis:
Carefully look the chart patterns like triangle, head and shoulder, wedge, flag or rectangle etc. These patterns, if found, offer accurate price predictions.
Step 5 Apply Technical Indicators for Confirmation of the Technical Analysis:
Apply technical indicators to confirm the above analysis i.e. market trend, strength of trend, and estimated market move. Most common technical indicators are; MACD, Bollinger Bands, Relative Strength Indicator.
Time Frame for Technical Analysis:
Technical analysis can be applied to various timeframes, ranging from intraday charts to long-term weekly or monthly charts. Different timeframes provide different perspectives on market trends and allow traders to adapt their strategies to their preferred trading style and time commitment.
Limitation of Technical Analysis:
While technical analysis of financial markets is a valuable tool, it is important to acknowledge its limitations. Technical analysis does not consider fundamental factors, such as company financials or economic indicators, which can significantly impact market movements. It is important to use technical analysis in conjunction with fundamental analysis and sentimental analysis, and exercise risk management to mitigate potential losses.
Final Remarks:
Technical analysis is a valuable tool that can assist traders in understanding the financial market trends and identifying potential trading opportunities. By mastering and applying the principles of technical analysis, traders can enhance their chances of success in uncertain realm of the financial markets.