Gold price chart technical analysis reveals that the trend is bearish for the medium term. The near-term downside target for gold price is $1857.25.
Signs for Downtrend:
- Uptrend line broken and retested:
The gold price uptrend, which started in November 2023, is reflected by the uptrend line. Not only this uptrend line is broken but it has been retested as shown in the figure below.

- Downtrend with clear lower lows:
The formation of lower lows and lower highs reflects a clear downtrend that prevails in the gold price chart.
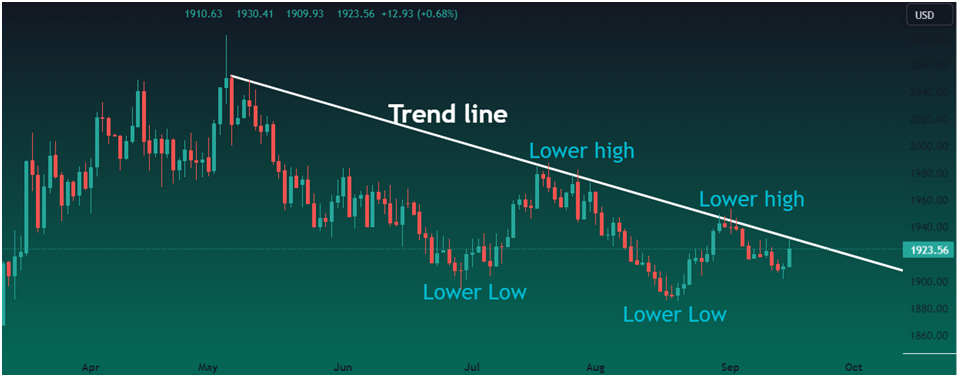
- Another Up-Trend line Broken:
Another obscure trend line is shown in the figure below. Every time the price approached the trend line it bounced in the form of a double bottom. However, this uptrend line is also broken and retested which strengthens the downtrend.

Medium Term Target:
Medium-term targets can be estimated by applying the Fibonacci extension of the previous downside wave. 100% extension of the previous wave is completed at 1857 where the supportive zone also lies at 1858. So the medium-term target of gold price is 1857.25.

The above technical analysis of gold price reflects that a clear downtrend prevails in the gold price. The medium-term target for gold price lies at 1857.25.