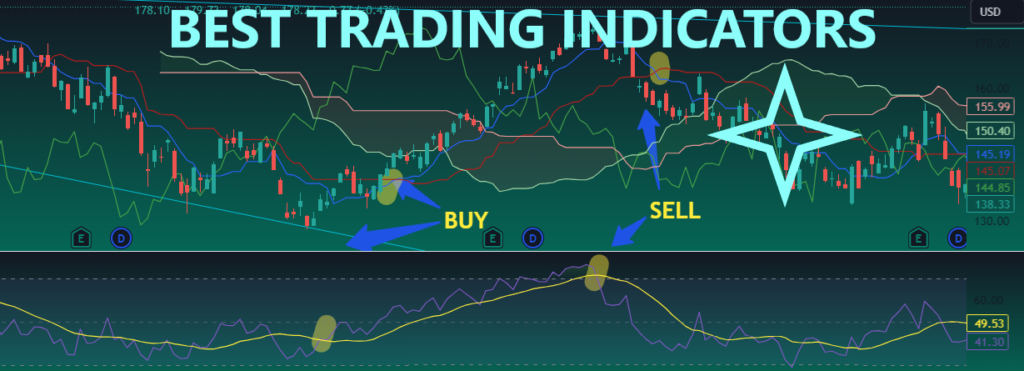
Swing trading is a popular trading strategy that aims to capture short- to medium-term price swings within an established trend. To identify potential swing trading opportunities and make well-informed trading decisions, you can use top swing trading indicators that provide insights into market momentum, trend direction, and potential reversals.
In this article, we will delve into the world of swing trading indicators, exploring some of the most effective tools used by consistently profitable swing traders.
Contents
Key characteristics of swing trading indicators:
- Fast response
- More weight-age to recent trade data
- Trend direction identifier
5 Best Swing Trading Indicators
1. Stochastic Oscillator:
Stochastic oscillator is a perfect indicator for swing trading. It quickly identifies a changing trend and thus spots swing alteration. Whenever stochastic creates a cross in an overbought or oversold region, it creates a selling or buying opportunity.
2. MACD Histogram:
MACD histograms can quickly detect a changing trend. For an ongoing trend, the height of the MACD histogram should rise, indicating a strong trend. When MACD histograms stop rising in height, it indicates a weakness of the current trend and the possibility of a trend reversal. So, changes in market trend are reflected in advance in the MACD histogram.
3. Elder Force Index (EFI):
It is quite accurate in identifying a new swing. Whenever the EFI line rises above the zero line, it identifies an up-swing and trade opportunity on the buy side. Conversely, if the EFI line crosses below the zero line it indicates a down-swing and sell-side trading opportunity.
4. Bollinger Bands:
Bollinger band is a simple but effective indicator for swing trading. It allows to trade price volatility during market swings. The width of Bollinger Bands represents market volatility.
A buy signal is generated when after returning from the lower band line, the market price crosses above the center line of the Bollinger band. Uptrend prevails as long as the price remains above the center line. However, if the price moves rapidly to close outside the Bollinger band, it is a sign of an overbought market and it should caution a trader to book a long position. The Converse is true for a downtrend and sell trade is initiated as the price crosses below the BB center line after hitting the upper boundary of the cloud.
5. Stochastic RSI:
RSI is a trend-following indicator that accurately identifies a trend but fails to identify when a trend is changing. Swing trading requires quick identification of trend change. To cater to this, we can modify RSI to gain the benefit of trend analysis and apply a trend identifier tool.
For this, apply the default RSI to the price chart and add the Moving Average (9) of the RSI line. As soon as the RSI line crosses above MA-9, a buy signal is generated. Conversely, a sell signal is created when the RSI line crosses the MA-9 line downward. This modified form makes RSI one of the best swing trading indicators.
Final Note:
Swing trading requires a strategic approach to capitalize on short- to medium-term market swings. Integrating the right set of indicators into your swing trading strategy can significantly enhance your ability to identify profitable trade setups and make informed trading decisions.
While the selection of swing trading indicators may vary depending on individual trading styles and preferences, the aforementioned indicators have proven to be effective tools for many swing traders. It is crucial to understand the calculations, interpretations, and limitations of each indicator before incorporating them into your swing trading strategy. Additionally, combining indicators with proper risk management techniques, thorough analysis of price action and market conditions, and disciplined trade execution will further increase your chances of success as a swing trader.

