Technical analysis of Bitcoin price chart reveals that a bullish trend has started. This study analyzes trend lines, chart patterns, and price action to find ongoing trend. The medium-term upside price target of Bitcoin is also determined through the analysis.
Contents
4 Clear Evidence for Bullish Trend in Bitcoin:
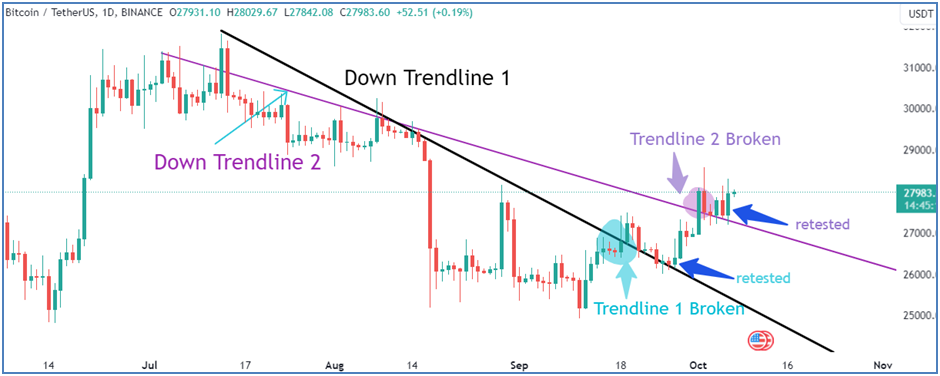
1. Downtrend line Broken Upwards:
Two downtrend lines are shown in the figure below. Both of the downtrend lines are broken upwards which indicates that no downtrend prevails for now. The end of the bearish trend is the first sign of the bullish trend.
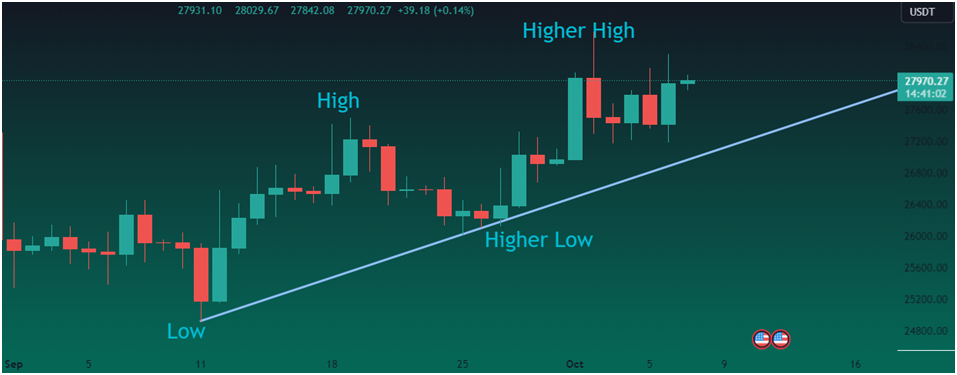
2. Bullish Trend is Evident from New Up-Trend Line:
A new trend line is formed with clear higher low and higher high. It suggests a clear bullish trend in Bitcoin.
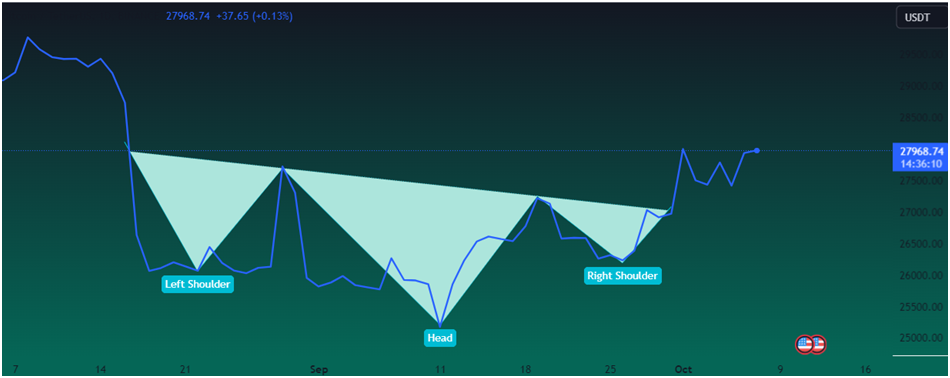
3. Inverse Head & Shoulder Pattern Suggests Bottom:
Technical pattern ‘inverse head & shoulder’ formation identifies the bottom formation in a downtrend. The figure below shows an inverse head & shoulder pattern formed in the Bitcoin price chart. So after bottom formation, the time is for an uptrend in BTC.
4. Price Range on Weekly Timeframe Implies Upside Move:
A decent price range is formed in Bitcoin weekly price chart. According to this price range, it is the turn of the upside move.
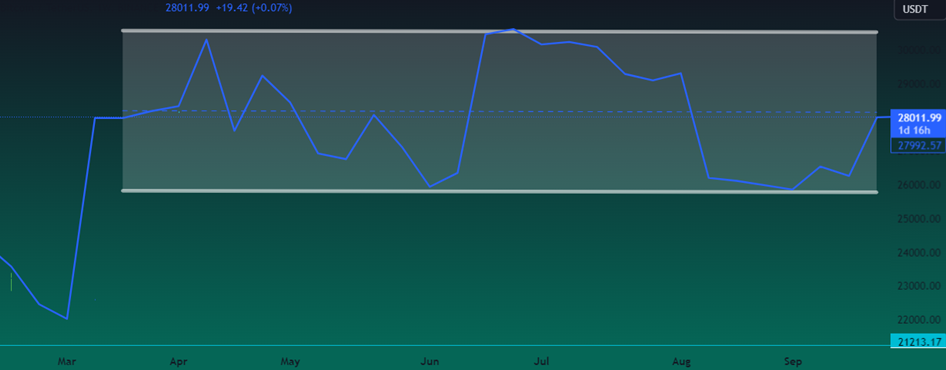
Medium-Term Price Target for Bitcoin:
The medium-term upside target of Bitcoin can be determined by the upper side of the weekly price range. Accordingly, the upside target lies around $31,000.