The most pivotal point for the success of a trader is how accurately he/she is able to determine equity market trend. Trend determination comprises of these two basic questions;
‘What is market trend or direction?’
‘How long a trend will prevail?’
A successful response to these questions is pivotal for making or losing money in equity markets.
Technical analysts have devised various techniques for trend determination. Most reliable trend analysis methods are discussed here with examples of trend analysis of forex, stocks, and crypto charts.
Contents
What is Trend Determination?
Trend determination is the process of studying chart price movement to predict the direction of future price movement. Trend has three directions: uptrend, downtrend, and range bound. Once the trend direction is determined, its strength is analyzed to have an idea of the duration for which the trend will be sustained.
Technical analysis offers various techniques to determine and analyze the trend of equity markets. Described below are the top 5 trend determination techniques.
1. Trend Determination By Trend Line Construction:
Trend line is the most widely used method for trend determination. To find a trend of any chart, connect the lowest points of successive troughs. If the slope of the trend line is positive, it is an uptrend, otherwise a downtrend. The higher the slope of the trend line, the stronger the trend. However, a very steep trend rarely stays and it has to correct itself through correction or retracement. Trend lines with slope around 45 degrees are the most strong and reliable to stay in trend for longer periods.
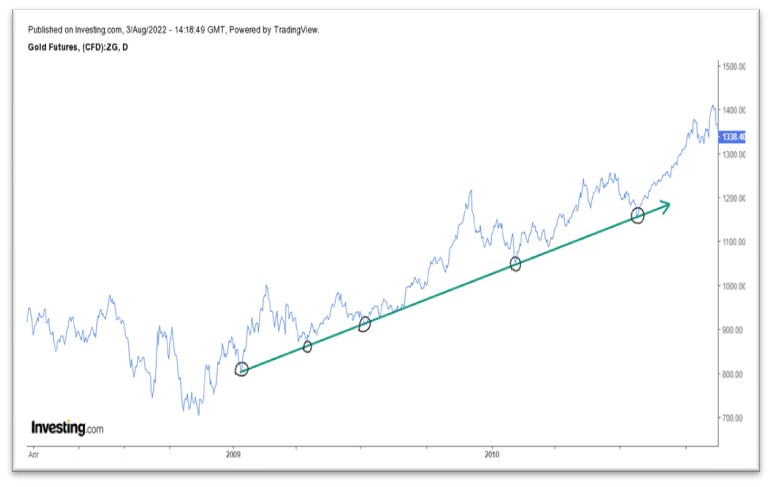
Example: Gold trend determination by Trend line
The figure below shows gold trend determination through trend line. The trend line is drawn by connecting the lowest points on successive troughs. The trend is upward as identified by the trend line.

A point to be noted is that a trend line connecting more points in successive lows is more authentic.
A trend remains in place until the trend line is breached by a significant price move crossing the trend line. Anyhow, sometimes false break out of trend line also occurs.
2. Trend Analysis by Moving Average:
Moving average is another simple method of trend analysis. A moving average is the price for specific days divided by the number of days for which a moving average is being calculated.
If the moving average line is inclined upward, it is uptrend. Contrarily, if the moving average slopes downward, it is a downtrend.
It is useful to draw a moving average for trend determination because it covers minor whipsaws in price movement.
All the trading software allow built-in functions for the construction of moving average lines over a specified duration.
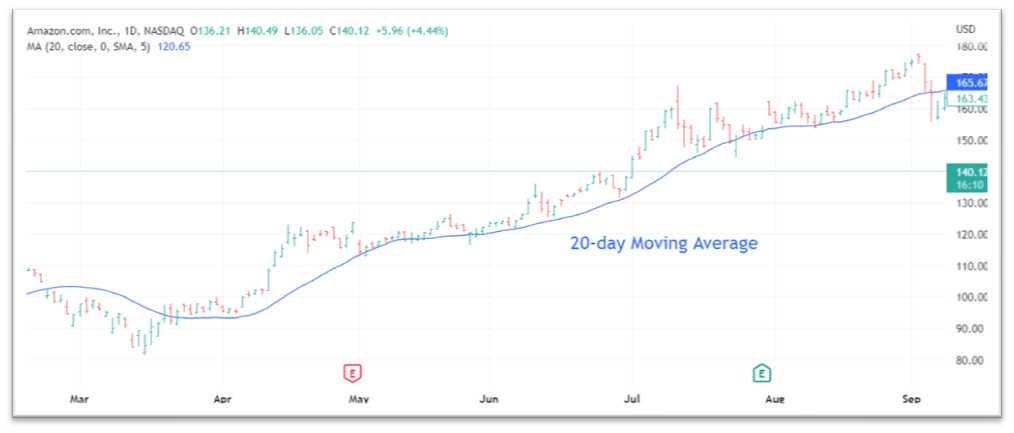
Example: Amazon stock trend determination through Moving Average technique
Moving average trend analysis with an example of Amazon.com chart is shown in the figure below. A 20-day moving average is plotted for trend determination. As the moving average is sloped up, the trend is upward.

Special Tips:
- For short-term trend analysis, a short-moving average (10, 20 days) should be applied. For long-term trend determination, a longer average (50, 100, 200 days) should be applied.
- The slope of moving average line measures the strength of a trend. A more inclined moving average represents a strong trend.
While using the moving average, the extent of correction during a rally is difficult to differentiate. So along with moving average, any other method of trend analysis should also be utilized.
3. Speed Resistance Lines for Trend Analysis:
It is a technique for trend analysis that helps to predict the possible correction during a trend. During an uptrend, the price takes a downward retracement. How much this retracement will be?
Speed resistance lines suggest that a trend usually retraces one-third of the total amount of rally. If prices fail to sustain at one-third retracement, it will take two-third retracement. Sliding below two third retracement means the previous trend has finished and trend change is about to take place.
To draw speed resistance lines;
Step1: draw a horizontal line at trend bottom.
Step2: draw a vertical line from the trend top up to the bottom horizontal line.
Step3: Divide this vertical line in one-third and two-thirds.
Step4: Draw two lines at the points connecting one-third and two-thirds on the vertical line.
Example: Tesla stock trend analysis through speed resistance lines
Shown in the figure below is an hourly chart of Tesla. Speed resistance lines are drawn for trend analysis. Purple lines represent speed resistance lines. Observe that when the one-third speed resistance line failed to support the price, the trend took support at two-thirds line.

Through the speed resistance line, a trader can analyze the amount of correction the price is going to take during a trend.
4. Trend Analysis through Fibonacci Fan:
Trend analysis through Fibbonacci fan is similar to speed resistance lines except that supportive lines are divided at Fibbonacci numbers i.e. 23, 38, 62, and 78 rather than one-third and two-thirds.
Fibonacci discovered these numbers according to the sequence of various things in nature, so they hold true for human psychology as well.
Plotting Fibonacci is pretty simple. All trading software provide an in-built function to plot Fibonacci resistance lines.
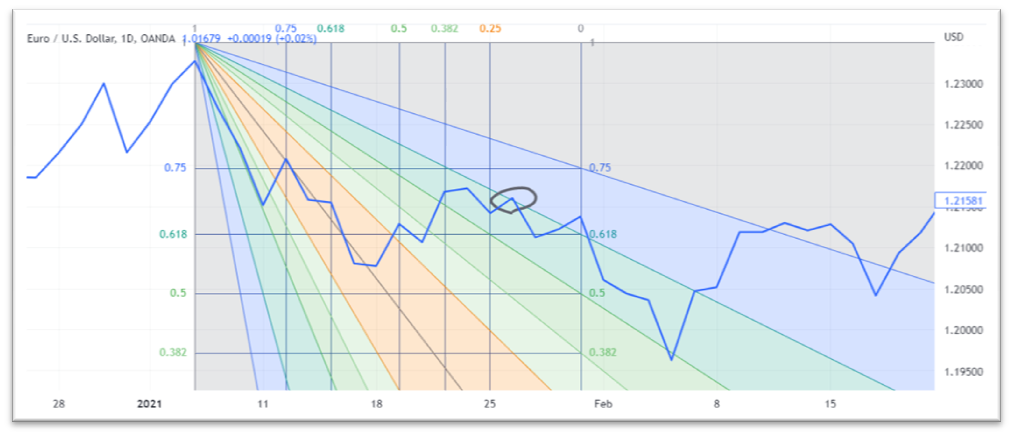
Example: EURUSD trend determination through the Fibonacci Fan technique
Plotted in the figure below is a forex chart of the EURUSD currency pair. To analyze the trend of this forex chart, the Fibonacci fan is plotted by connecting the top to the first low of the price. It is observed that the price took an upward correction up to 0.618 Fibonacci line.

So Fibonacci is an important trend analysis technique that gives probable retracement or reaction during a trend.
5. Trend Determination by Ichimoku Cloud:
Ichimoku cloud is one of the reliable trend determination techniques. It offers trend direction as well as support and resistance zones. It has three parts;
1. A Cloud. When the price is above the cloud, the trend is upward and the cloud acts as a support zone. When the price is below the cloud, the trend is downward and the cloud acts as a resistance zone.
2. Baseline and Conversion line. When the conversion line is above baseline, the trend is upward and vice versa.
3. A Lagging span. The price above lagging span confirms whether the analysis was correct or not. In an uptrend, the lagging span is far below price and cloud, and vice versa.
Technical analysis software and websites like tradingview.com, MT4/5 etc. offer built-in features to plot the Ichimoku cloud with just 2 clicks.
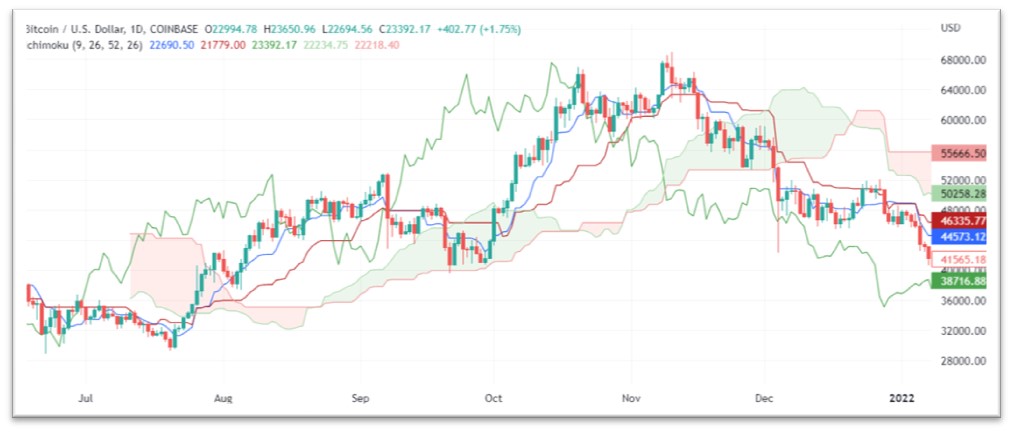
Example: Bitcoin Trend analysis through Ichimoku cloud
Trend analysis of Bitcoin graph is shown in the figure below. Here Ichimoku cloud has been plotted by using an in-built function. Observe that when the price is above cloud, it is uptrend. Also blue signal line crossed above the red baseline to give an uptrend signal. Similarly, the lagging span denoted by the green line also confirms the uptrend.

End Note:
Above mentioned trend determination techniques provide a quick picture of the market trend direction. However, some of the techniques may lag in identifying when a trend is changing. To enhance the accuracy of trend analysis, the application of more than one trend analysis technique is recommended.
